Caution
This is the documentation for the current development branch of the CometVisu. It is possible that some of the described features are not yet available in the current release.
Also there might be lots of errors in this documentation as some parts of the content have been translated by an online translation service.
Chart
Description
The chart element allows the visualization of historical values as a diagram.
For this, the chart element must contain at least one <dataset> child element.
For each <dataset> a line is drawn in the chart.
<cv-widget size="2x1">
    <cv-tile>
        <cv-chart title="Living room" y-format="%.1f °C" series="day" refresh="300" colspan="3" rowspan="3">
            <dataset chart-type="line" src="openhab://Temperature_FF_Living"/>
        </cv-chart>
    </cv-tile>
</cv-widget>
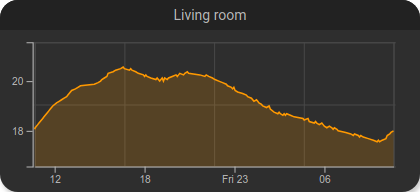
The example shows the temperature curve of the last 24 hours, the exact, formatted temperature value for a point in the
chart is displayed as a tooltip when hovering over the chart.
In order for the chart to reach a certain size, a tile with double width <cv-tile size="2x1"> is used here and the
chart itself should fill the entire tile <cv-chart ... colspan="3" rowspan="3">.
Configuring the data source
In the src attribute of the dataset element, a URL is specified that defines the data source. So far
openHAB (Persistence), InfluxDB and RRD are supported as data sources.
configuring an openHAB-source
openhab://<Item-Name> where <Item-Name> can be any item name in openHAB for which historical data is recorded.
It is also possible to specify a specific persistence service if you use multiple:
openhab://<service-id>@<Item-Name>, if you do not specify this, the default persistence service configured in openHAB is used.
configuring einer InfluxDB-source
flux://<organization>@<bucket>/<measurement>/<field> Optional parameters for the
aggregationWindow function can be added as
query parameters. These require the prefix ag-. Example:
flux://cometvisu@cv-bucket/Temperature/value?ag-every=1d&ag-fn=mean would send the following Flux query to the
database:
from(bucket:"cv-bucket")
  |> range(start: <start-time>, stop: <end-time>)
  |> filter(fn: (r) => r._measurement == "Temperature" and r._field == "value")
  |> aggregateWindow(every: 1d, fn: mean)
If only ag-every is specified, “mean” is taken as the default value for ag-fn. If only ag-every is specified,
the values are automatically determined based on the series used by the chart.
For more complex database queries, the code of the Flux query can also be specified directly as text content of the <dataset> element.
In this case, only the organization and the note that the query was specified “inline” must be specified in the src attribute.
<dataset src="flux://openhab@inline">
    from(bucket:"openhab")
        |> range(start: -2d)
        |> filter(fn: (r) => r._measurement == "Counter" and r._field == "value")
        |> aggregateWindow(every: 1d, fn: last)
        |> difference()
</dataset>
With this query, the time range is set to the last 2 days (range(start: -2d)) and is therefore no longer variable and
overwrites or deactivates the possibility to select other time series via selection. To use this feature, a placeholder
must be inserted and the aggregateWindow must be omitted (this is automatically selected according to the selected time series).
The upper query would look like this:
<dataset src="flux://openhab@inline">
    from(bucket:"openhab")
        |> range($$RANGE$$)
        |> filter(fn: (r) => r._measurement == "Counter" and r._field == "value")
        |> difference()
</dataset>
Hint
Since the CometVisu itself cannot check whether the Flux code is correct, it is recommended to compile the query in the UI of the InfluxDB and then copy the working code.
Hint
If multiple inline queries are used in one chart, the value of the src attribute within this chart must be unique.
To do this, simply append a consecutive number, e.g. flux://openhab@inline#1 and flux://openhab@inline#2.
The URI of the InfluxDB server and a token for authenticating the requests must be specified in the hidden configurations under the section “influx”. The following key-value entries are required in this section.
Key |
Value |
uri |
http://<influx-server>:8062 |
token |
API Token (can be generated in the influxdb-UI) |
config |
flux |
The values for “uri” and “token” must be adjusted accordingly, the value for “config” must be “flux” so that the communication can work correctly.
Configuring a RRD-source
rrd://<filename-without-rrd> For the RRD data source, the file name without the “.rrd” at the end must be specified.
Additional query parameters can be added:
ds: Select one of the available Consolidation Functions of the RRDTools (http://rrdtool.org).res: The default resolution for the data from the RRD file can be overridden with its own second value.
Example: rrd://<dateiname-ohne-rrd>?ds=AVERAGE&resolution=3600
Add more sources via plugins
Since the CometVisu does not directly support all data sources, additional ones can be added via plugins. For this purpose, a plugin must be created that queries the data source and passes the data to the chart element. The creation and integration of this plugin consists of 3 steps:
Create a Javascript file in the config/media directory.
- Create a class in it with the following code as a basis extended by the desired functionality:
- Load this file in the CometVisu configuration, add the following to the
<cv-meta>element: <cv-loader type="js" src="resource/config/media/<filename>.js"/>and enter the name of the new file.
- Load this file in the CometVisu configuration, add the following to the
You can find more information in the source code of the template.
More examples
It is also possible to display multiple lines in a chart and to color them differently.
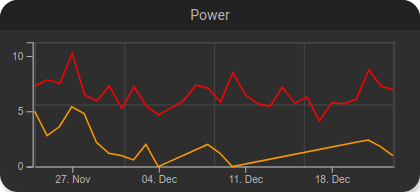
Two lines in one chart.
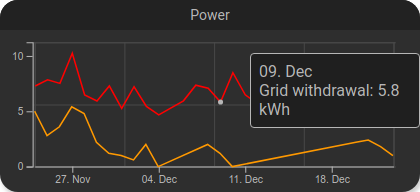
Tooltip with single values.
<cv-widget size="2x1">
    <cv-tile>
        <cv-chart title="Power" y-format="%.1f kWh" series="month" refresh="300" colspan="3" rowspan="3" x-format="%d. %b">
            <dataset src="openhab://Meter_Energy_Grid_Import_Today" title="Grid withdrawal" color="#FF0000" show-area="false"/>
            <dataset src="openhab://PV_Energy_Today" color="#FF9900" title="Production"/>
          </cv-chart>
    </cv-tile>
</cv-widget>
The red line shows the daily withdrawal from the power grid in kWh and the orange area shows the daily PV production in kWh.
The chart element also offers the possibility to display a bar chart:
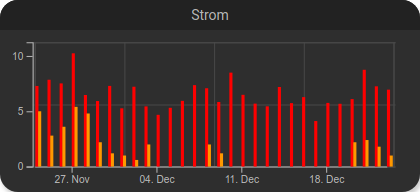
Two bars in one chart.
<cv-widget size="2x1">
    <cv-tile>
        <cv-chart title="Power" y-format="%.1f kWh" series="month" refresh="300" colspan="3" rowspan="3" x-format="%d. %b">
            <dataset src="openhab://Meter_Energy_Grid_Import_Today" title="Grid withdrawal" color="#FF0000" show-area="false" chart-type="bar"/>
            <dataset src="openhab://PV_Energy_Today" color="#FF9900" title="Production" chart-type="bar"/>
          </cv-chart>
    </cv-tile>
</cv-widget>
If you want to switch to other time series and navigate within the currently selected one, you can unlock these with
the selection attribute. This can be filled with a comma-separated list of allowed time series, or simply with all.
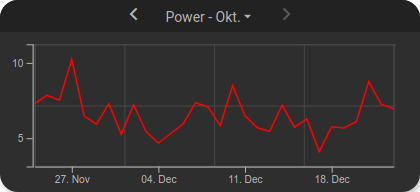
Time series selection.
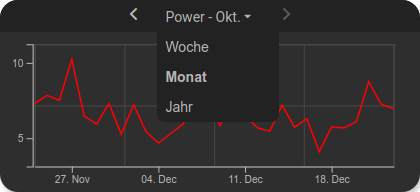
Opened time series selection
<cv-widget size="2x1">
    <cv-tile>
        <cv-chart title="Power" selection="week,month,year" y-format="%.1f kWh" series="month" refresh="300" colspan="3" rowspan="3" x-format="%d. %b">
            <dataset src="openhab://Meter_Energy_Grid_Import_Today" title="Grid withdrawal" color="#FF0000" show-area="false"/>
          </cv-chart>
    </cv-tile>
</cv-widget>
Further display options
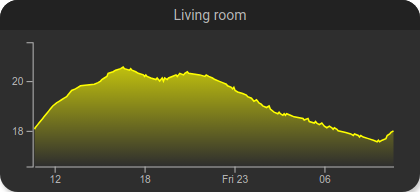
There are various options to influence the display of the chart. For example, you can hide the lines in the background
(show-grid="false"), hide the area below the line with a gradient (gradient="true") or change the line color (line-color="#FFFF00").
<cv-widget size="2x1">
    <cv-tile>
        <cv-chart title="Living room" y-format="%.1f °C" series="day" refresh="300" colspan="3" rowspan="3" show-grid="false">
            <dataset chart-type="line" gradient="true" color="#FFFF00" src="openhab://Temperature_FF_Living"/>
        </cv-chart>
    </cv-tile>
</cv-widget>
Simple lines
To highlight / mark certain points in the chart, horizontal and vertical lines can be inserted. With a vertical line, a certain time can be marked (e.g. the current time or midnight). With a horizontal line, a certain value can be marked (e.g. a threshold), or an average, maximum or minimum value.
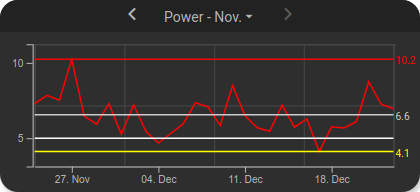
Chart with horizontal lines.
<cv-widget size="2x1">
    <cv-tile>
        <cv-chart title="Power" selection="month" y-format="%.1f kWh" series="month" refresh="300" colspan="3" rowspan="3" x-format="%d. %b">
            <dataset src="openhab://Meter_Energy_Grid_Import_Today" title="Grid withdrawal" color="#FF0000" show-area="false"/>
            <h-line src="openhab://Meter_Energy_Grid_Import_Today" show-value="true" color="#FF0000" value="max" format="%.1f"/>
            <h-line src="openhab://Meter_Energy_Grid_Import_Today" show-value="true" color="#CCCCCC" value="avg" format="%.1f"/>
            <h-line src="openhab://Meter_Energy_Grid_Import_Today" show-value="true" color="#FFFF00" value="min" format="%.1f"/>
            <h-line color="#FFFFFF" value="5"/>
          </cv-chart>
    </cv-tile>
</cv-widget>
For the horizontal lines, a <h-line> is created with the same data source as the line and the value avg for the average
in value. The average value is then displayed as a horizontal line in the chart.
With show-value="true" it is specified that the value is displayed next to the line.
Other values for value are min, max or a fixed value.
Inline queries can also be referenced this way:
<cv-widget size="2x1">
    <cv-tile>
        <cv-chart title="Strom" selection="month" y-format="%.1f kWh" series="month" refresh="300" colspan="3" rowspan="3" x-format="%d. %b">
            <dataset src="openhab://inline#1" title="Grid withdrawal" color="#FF0000" show-area="false">
                ...
            <dataset>
            <dataset src="openhab://inline#2" title="Grid injection" color="#00FF00" show-area="false">
                ...
            <dataset>
            <h-line src="openhab://inline#1" show-value="true" color="#FF0000" value="avg" format="%.1f"/>
            <h-line src="openhab://inline#2" show-value="true" color="#CCCCCC" value="avg" format="%.1f"/>
          </cv-chart>
    </cv-tile>
</cv-widget>
Vertical lines
The vertical lines allow only fixed value.
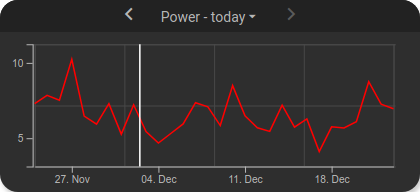
Chart with vertical line
<cv-widget size="2x1">
    <cv-tile>
        <cv-chart title="Power" selection="day" y-format="%.1f kWh" series="day" refresh="300" colspan="3" rowspan="3" x-format="%d. %b">
            <dataset src="openhab://Meter_Energy_Grid_Import_Today" title="Grid withdrawal" color="#FF0000" show-area="false"/>
            <v-line color="#FFFFFF" value="2022-12-02T12:00:00"/>
          </cv-chart>
    </cv-tile>
</cv-widget>
Allowed attributes
Element |
Attribute |
|||
|---|---|---|---|---|
Name |
Content |
Description |
||
cv-chart |
title |
string |
Title of the chart. |
|
y-format |
string |
Format the value on the y-axis. (printf syntax) |
||
x-format |
string |
Format of the date on the x-axis. (see: https://d3js.org/d3-time-format#locale_format). If this value is not provided its automatically determined based on the currently shown ‘series’. Defining an explicit formatting overrides this. |
||
series |
hour, day, week, month or year |
Time span of the data. |
||
selection |
string |
Type of the chart element. |
||
allow-fullscreen |
true or false |
Allows showing the chart in fullscreen size. |
||
show-x-axis |
true or false |
Show x-axis scale (default = true). |
||
show-y-axis |
true or false |
Show y-axis scale (default = true). |
||
refresh |
decimal |
Time interval in seconds this widget is being refreshed. |
||
show-grid |
xy, x, y or false |
Show grid lines. |
||
background |
true or false |
Show the chart in the background of a tile. |
||
min |
decimal |
Minimum value. |
||
max |
decimal |
Maximum value. |
||
visible-on |
mobile or desktop |
Controls this element’s visibility by screen size. |
||
class |
string |
Add this value to the CSS class so that it can be formatted by a user provided style sheet. |
||
style |
string |
Custom CSS style rules for this widget. |
||
row |
1, 2, 3, first, middle or last |
Row number or position (first, middle, last) |
||
column |
1, 2, 3, first, middle or last |
Column number or position (first, middle, last) |
||
rowspan |
integer |
Number of rows this element spans |
||
colspan |
integer |
Number of columns this element spans |
||
Allowed child elements and their attributes
Element |
Attribute |
|||
|---|---|---|---|---|
Structure |
Name |
Content |
Description |
|
|
src |
anyURI |
Data source for this chart element |
|
title |
string |
Title of the chart element. |
||
chart-type |
line or bar |
Type of the chart element. |
||
curve |
linear, step or natural |
Type of curve interpolation for line charts. |
||
color |
string |
Color of the chart element. |
||
show-area |
true or false |
Fill the area below a line diagram (default=true). |
||
gradient |
true or false |
Fill the area below a line diagram with a linear gradient (show-area must not be “false”). |
||
|
string |
|||
Element |
Attribute |
|||
|---|---|---|---|---|
Structure |
Name |
Content |
Description |
|
|
src |
string |
Data source for this line |
|
color |
string |
Color of the line. |
||
show-value |
true or false |
Show value. |
||
value-color |
string |
Color of the value. |
||
value |
Type of the chart element. |
|||
format |
string |
Format the value on the y-axis. (printf syntax) |
||
Element |
Attribute |
|||
|---|---|---|---|---|
Structure |
Name |
Content |
Description |
|
|
src |
string |
Data source for this line |
|
color |
string |
Color of the line. |
||
show-value |
true or false |
Show value. |
||
value-color |
string |
Color of the value. |
||
value |
Date where the vertical line should be shown on the x-axis. |
|||
format |
string |
Format of the date on the x-axis. (see: https://d3js.org/d3-time-format#locale_format). |
||